Public sector grantmaking is more complex than ever. Budgets are in flux, appropriations are delayed, and leaders are under pressure to deliver impact with fewer resources. You're expected to stay audit-ready, make data-informed decisions, and demonstrate results—while working across siloed systems that limit visibility.
Static reports and manual processes can’t keep up. Yet many teams still spend hours stitching together disconnected data just to get a basic view of operations.
That’s starting to change.
Leaders are rethinking how they use grant data—not just for compliance, but to lead with clarity and confidence. When insights are accessible in real time, they power better decisions, improve coordination, and reduce risk.
And this shift doesn’t require a full tech overhaul. It starts by embedding intelligence into the tools you already use.
How Embedded Insight Is Transforming Executive Leadership
In 2025, it’s not just what you report—it’s how quickly and clearly you can act on what your data is telling you.
That’s why a growing number of government teams are turning to embedded Business Intelligence (BI) tools to bring clarity to their grantmaking. These tools make it possible to zoom out for a strategic view or drill down into the details without relying on static spreadsheets or manual updates.
For example, Fluxx’s integrated BI tool, Grantelligence, lets agencies build and embed executive dashboards directly into their grants management system. These dashboards deliver real-time visualizations of financial health, program performance, and potential risk areas without adding operational burden or new software to manage.
Unlike traditional BI tools like Tableau or Power BI, which often require complex integrations and months of IT support, Grantelligence is purpose-built for grantmaking. It’s already part of your system, so there’s no need for extra infrastructure, custom models, or external consultants.
The result is fast, intuitive access to the insight you need right when you need it.
With this kind of visibility, you can:
- Compare budgets to actuals in real time
- Track funding status across programs
- Spot early indicators of risk
- Measure alignment with strategic goals
When leadership is supported by live, accurate insight, you don’t just stay informed, you stay ahead.
To see what this looks like in practice, here’s a closer look at the executive-level dashboards Grantelligence makes possible and how they translate complex data into clear, actionable insight:
Examples of Grantelligence Dashboards:
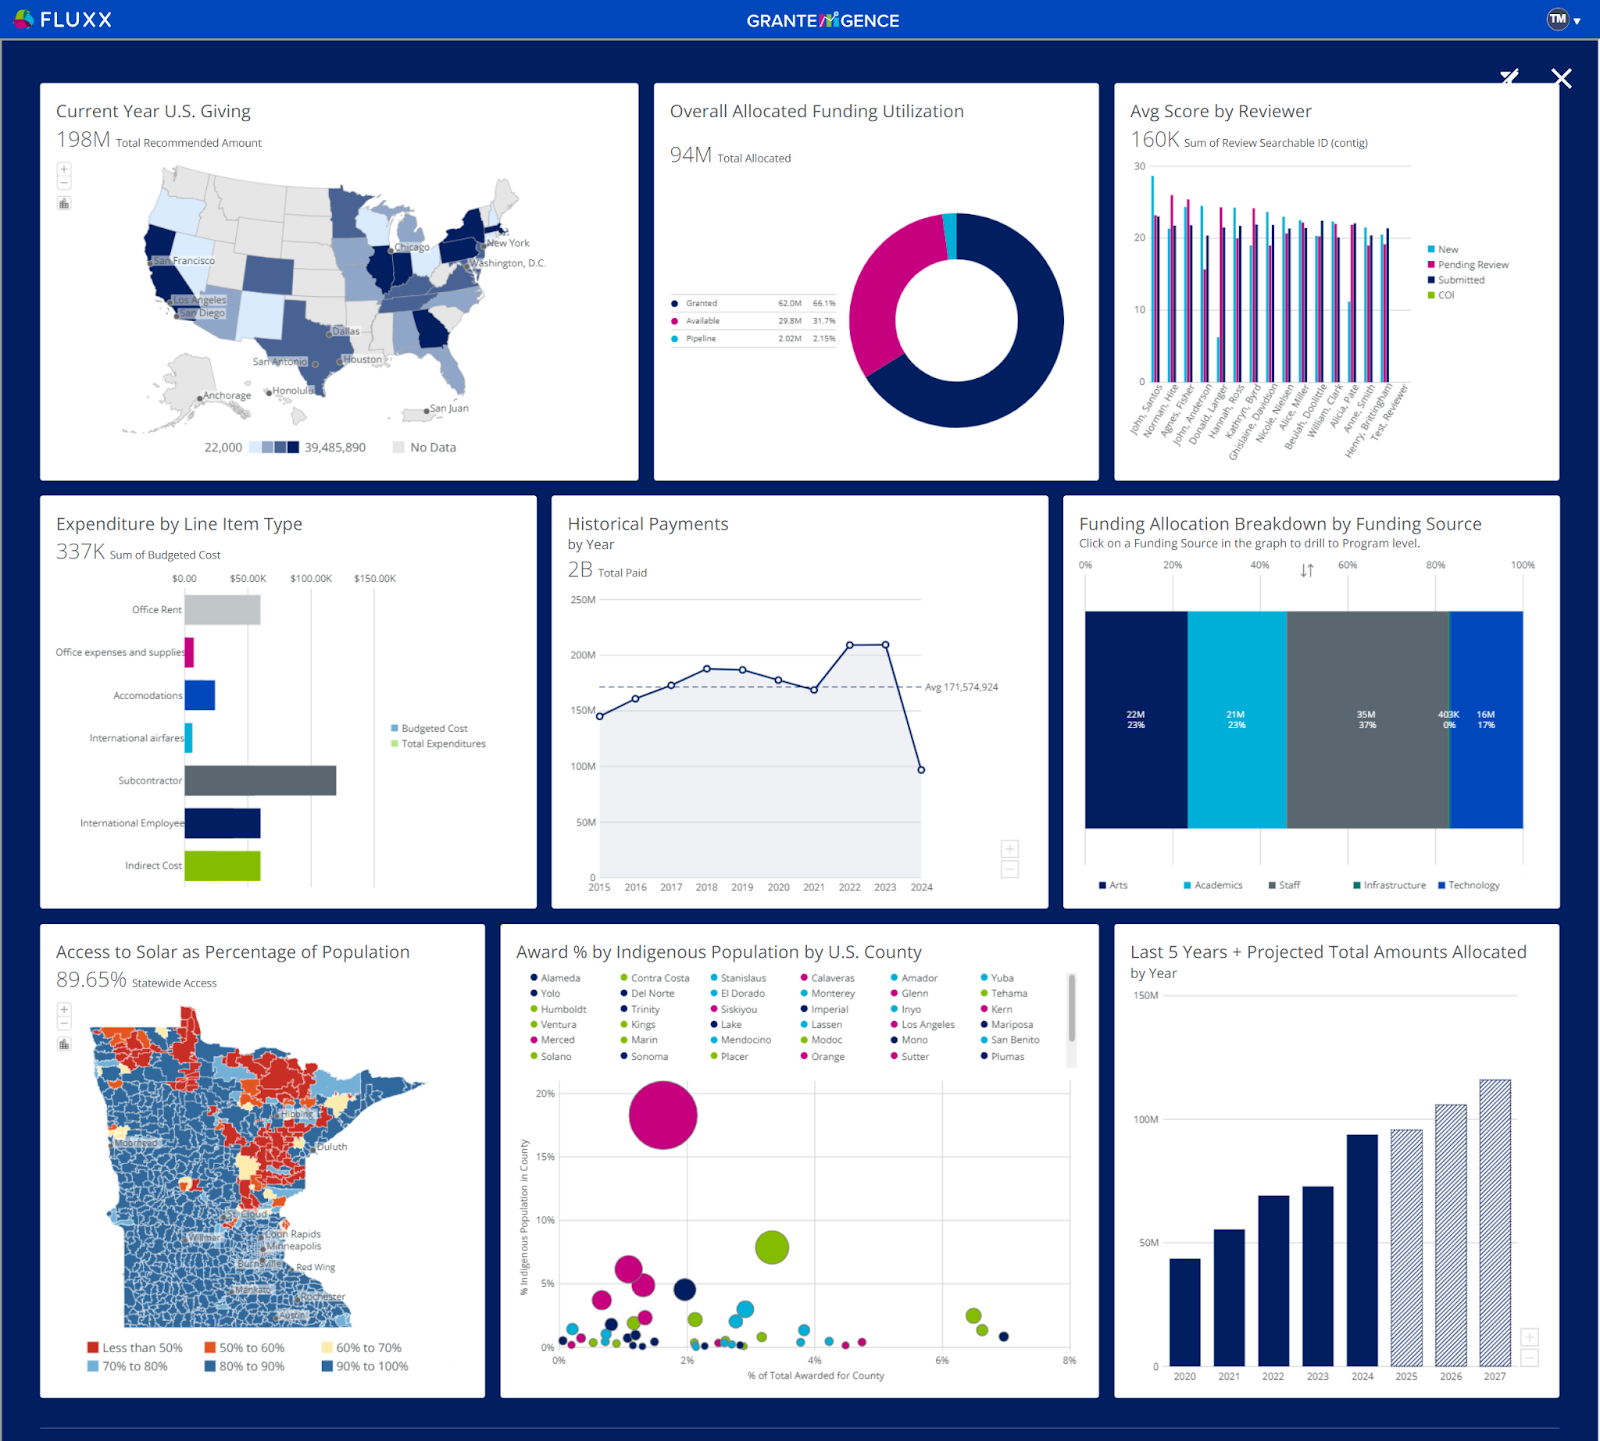
Executive Dashboard
Purpose: Deliver a strategic, high-level overview of your organization’s grants management and financial position.
Why It Matters: This dashboard consolidates essential insights like grant allocation, financial execution, risk exposure, and impact into one view. Executives can use it to evaluate how well resources are being deployed, whether activities align with strategic priorities, and where intervention may be needed to stay on track.
Key Metrics Tracked:
- Total Grant Funding Allocated vs. Spent
- Drawdown and Reimbursement Status (via Request Transaction ETL)
- Funded Amounts by Program and Funding Sourc
- Key Impact Metrics (e.g., milestones completed, beneficiaries served)
- Portfolio Risk Summary (e.g., overdue grantee reports, expired contracts)

.png)